The Price Volume Trend Oscillator
Traders are all looking for an edge and/or justification for entering and exiting a trade. All too often the decision is based on lagging (historical) information. There are few predictive indicators for the most part outside of regression and artificial intelligence (the best I have created to date is ~27% accurate). An interesting one is the Price Volume Trend Oscillator (PVT). It may be lagging but does give some value in gaging the percent change in price as attributed to volume.
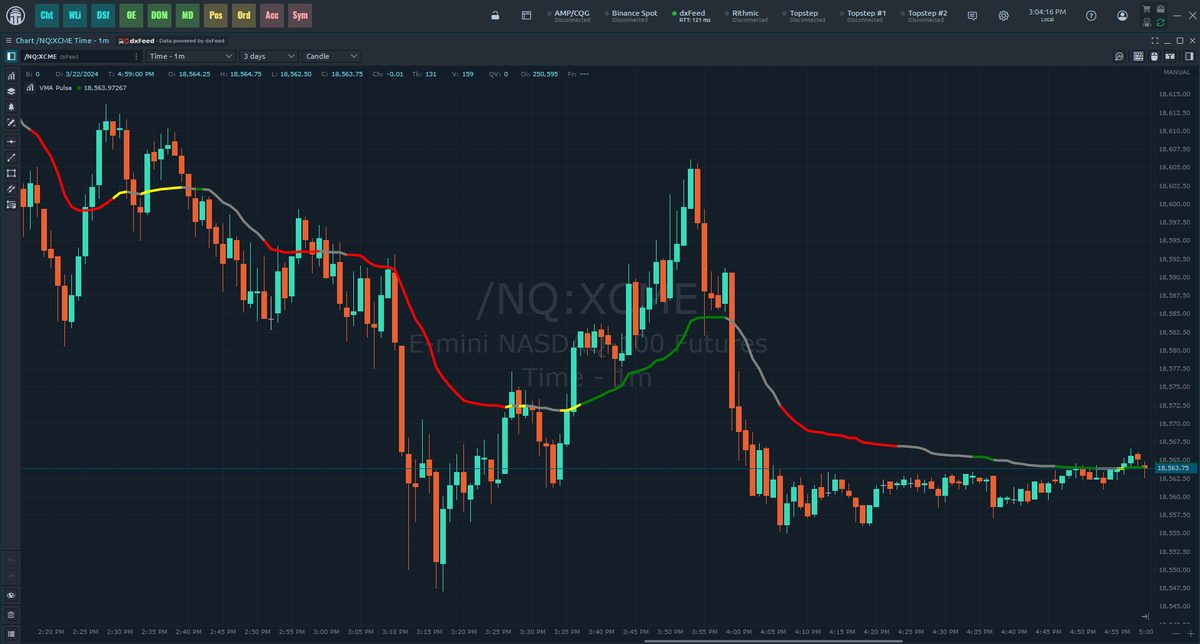
The Price Volume Trend Oscillator (PVT) is a momentum-based technical indicator that measures the relationship between price and volume. It was developed by Joseph Granville in the early 1960s and was first published in his book, New Concepts in Technical Trading Systems.
The PVT is calculated by multiplying the percentage change in price by the volume for each day, and then adding this value to a cumulative total. The PVT oscillates between positive and negative values, and can be used to identify changes in trend and overbought/oversold conditions.
The PVT is similar to the On-Balance Volume (OBV) indicator, but it has a few key differences. First, the PVT is calculated using the percentage change in price, while the OBV is calculated using the absolute change in price. Second, the PVT is a cumulative indicator, while the OBV is not. This means that the PVT can be used to identify longer-term trends, while the OBV is better suited for identifying shorter-term trends.
The PVT can be used to identify changes in trend in a number of ways. For example, a rising PVT indicates that buying pressure is increasing, while a falling PVT indicates that selling pressure is increasing. This information can be used to identify potential reversals in trend.
The PVT can also be used to identify overbought/oversold conditions. A PVT that is above the 80 level is considered to be overbought, while a PVT that is below the -80 level is considered to be oversold. These conditions can be used to identify potential entry and exit points for trades.
The PVT is a versatile technical indicator that can be used to identify changes in trend and overbought/oversold conditions. It is a valuable tool for traders who want to identify potential trading opportunities.
Sources:
- Granville, Joseph. New Concepts in Technical Trading Systems. New York: Trend Research, 1963.
- Murphy, John. Technical Analysis of the Financial Markets. New York: New York Institute of Finance, 1986.
- Schwager, Jack D. Market Wizards: Interviews with Top Traders. New York: HarperCollins, 1989.
Historical background:
The PVT was first introduced by Joseph Granville in the early 1960s. Granville was a well-known technical analyst and author who is credited with popularizing the use of momentum indicators in the trading community.
The PVT was originally designed to be used as a leading indicator of trend changes. However, it has since been found to be effective in identifying overbought/oversold conditions as well.
The PVT is a relatively simple indicator to use, but it can be a valuable tool for traders who want to identify potential trading opportunities.
Conclusion:
The PVT is a versatile technical indicator that can be used to identify changes in trend and overbought/oversold conditions. It is a valuable tool for traders who want to identify potential trading opportunities.
However, it is important to remember that the PVT is a lagging indicator and can produce false signals. Therefore, it should be used in conjunction with other technical indicators to confirm signals.
Disclaimer: This material is provided for educational and entertainment purposes only. It does not constitute trading or investment advice. Hypothetical performance has inherent limitations.