Boost Your Trading with Improved On-Balance Volume Analysis
The On-Balance Volume (OBV) is a powerful technical trading momentum indicator that leverages volume flow to predict changes in stock prices. In the intricate dance of the stock market, traders and investors are constantly on the lookout for tools that can give them an edge. Although it is often overshadowed by more complex indicators, the On-Balance-Volume (OBV) indicator is both simple and profound. Significantly, OBV offers a window into the momentum behind price movements, thus serving as a cornerstone for those who know how to use it effectively.
The Genesis of OBV
Interestingly, the OBV indicator was the brainchild of Joseph Granville, a notable financial writer and investment advisor (who also developed the Price Volume Trend oscillator). He introduced the OBV indicator in his 1963 book, “Granville’s New Key to Stock Market Profits”. Known for his flamboyant presentation style and bold market predictions, Granville highlighted the OBV as a method to measure buying and selling pressure. He proposed a straightforward premise: volume precedes price movement. Consequently, by tracking volume changes, one could potentially anticipate future price changes.
How OBV Works
Fundamentally, OBV is a cumulative tally. It adds volume on days the price closes higher, which is considered buying volume, and subtracts volume on days the price closes lower, regarded as selling volume. The OBV line that results provides a visual representation of this buying and selling pressure over time. For instance, a rising OBV line suggests bullish undercurrents as buying volume outstrips selling volume. Conversely, a falling OBV line indicates bearish trends, with selling pressure dominating.
How Does OBV Work?
- Volume Flow Prediction: OBV uses volume changes to make price predictions. When volume increases significantly without a corresponding change in the stock’s price, Granville envisioned it as a “spring being wound tightly.” Eventually, this pent-up energy would lead to either an upward or downward price movement.
- Calculation: The OBV calculation involves three rules:
- Should today’s closing price surpass yesterday’s, the current OBV will increase by the amount of today’s volume.
- On the other hand, if today’s closing price falls below yesterday’s, the current OBV will decrease by today’s volume.
- Should today’s closing price match yesterday’s, the current OBV will stay the same.
- Smart Money vs. Retail Investors: This distinction between smart money, such as institutional investors, and less sophisticated retail investors, is crucial. For example, as mutual funds and pension funds invest in an issue that retail investors are selling, volume may increase even if the price remains relatively stable.
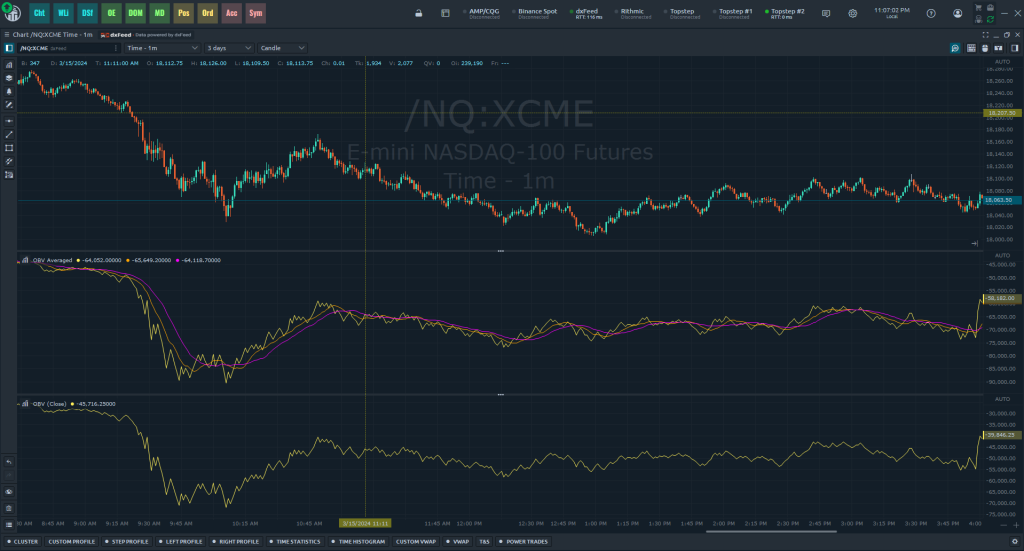
Beyond the Basics: Enhancing OBV with Moving Averages
Although the original OBV offers valuable insights, there is undoubtedly room for refinement. This is where the integration of moving averages into OBV becomes particularly interesting, an enhancement I have thoroughly explored in my work. By applying fast and slow-moving averages (like two SMAs or two EMAs) to the OBV line, traders can achieve a more transparent view of momentum shifts.
- Fast SMA: This shorter period moving average (e.g., 10 periods) reacts quickly to changes in OBV, providing early signals of momentum shifts.
- Slow SMA: The longer period moving average (e.g., 20 periods) smooths out short-term fluctuations, offering a clearer picture of longer-term momentum trends.
The interaction between these moving averages and the OBV line yields a more nuanced view of market dynamics. For instance, a crossover of the fast SMA above the slow SMA on the OBV line can be a strong bullish signal, indicating an uptrend in buying pressure.
Practical Application: The On_balance_Volume_with_averages Indicator
To put these insights into practice, I developed the “On_balance_Volume_with_averages” indicator. This enhanced tool not only tracks OBV but also includes the fast and slow-moving averages, thus providing a multi-layered analysis of volume momentum. It is designed for traders aiming to refine their market entry and exit points, offering a more detailed view of market sentiment.
Conclusion
The On-Balance Volume indicator, deeply rooted in market theory and practice, remains an indispensable tool in the trader’s arsenal. Its simplicity belies its ability to reveal the hidden forces of market momentum. By augmenting OBV with moving averages, we enhance Granville’s legacy, offering a more dynamic lens through which to view the ebb and flow of market sentiment. In the ever-evolving landscape of trading, such innovations keep us one step ahead, blending tradition with innovation in our quest for trading mastery.
Remember, while bananas might not be the standard unit of measurement for stock market indicators, understanding OBV can certainly help you navigate the financial jungle!
The following code was written in C# for Quantower:
using System;
using System.Collections.Generic;
using System.Drawing;
using System.Linq;
using TradingPlatform.BusinessLayer;

namespace On_balance_Volume_with_averages
{
    public class On_balance_Volume_with_averages : Indicator
    {
        [InputParameter("Fast SMA period", 10, 1, 9999, 1, 0)]
        public int FastPeriod = 10;

        [InputParameter("Slow SMA period", 20, 1, 9999, 1, 0)]
        public int SlowPeriod = 20;

        [InputParameter("MA Type", 30, variants: new object[] {
            "Simple", MaMode.SMA,
            "Exponential", MaMode.EMA,
            "Modified", MaMode.SMMA,
            "Linear Weighted", MaMode.LWMA
        })]
        public MaMode MAType = MaMode.SMA;

        private double previousClose = 0;
        private double obv = 0;
        private List<double> obvValues = new List<double>();

        public On_balance_Volume_with_averages()
        {
            Name = "On_balance_Volume_with_averages";
            Description = "My indicator's annotation";

            AddLineSeries("OBV Line", Color.Blue, 1, LineStyle.Solid);
            AddLineSeries("Fast MA", Color.Orange, 1, LineStyle.Solid);
            AddLineSeries("Slow MA", Color.Magenta, 1, LineStyle.Solid);

            SeparateWindow = true;
        }

        protected override void OnInit()
        {
            ShortName = "OBV Averaged";
        }


        protected override void OnUpdate(UpdateArgs args)
        {
            double currentClose = Close();
            double volume = Volume();

            obv += currentClose > previousClose ? volume : currentClose < previousClose ? -volume : 0;
            obvValues.Add(obv);
            SetValue(obv, 0); // Update the OBV line

            if (obvValues.Count >= FastPeriod)
            {
                double fastMAValue = CalculateMA(obvValues, FastPeriod, MAType);
                SetValue(fastMAValue, 1); // Update the Fast MA line
            }

            if (obvValues.Count >= SlowPeriod)
            {
                double slowMAValue = CalculateMA(obvValues, SlowPeriod, MAType);
                SetValue(slowMAValue, 2); // Update the Slow MA line
            }

            previousClose = currentClose;
        }


        private double CalculateMA(List<double> values, int period, MaMode maType)
        {
            // Select the MA calculation based on the maType
            switch (maType)
            {
                case MaMode.SMA:
                    return values.Skip(Math.Max(0, values.Count - period)).Take(period).Average();
                case MaMode.EMA:
                    // Implement EMA calculation
                    break;
                case MaMode.SMMA:
                    return CalculateSMMA(values, period);
                case MaMode.LWMA:
                    return CalculateLWMA(values, period);
                    break;
                default:
                    return 0;
            }
            return 0;
        }

        private double CalculateEMA(List<double> values, int period)
        {
            double k = 2.0 / (period + 1); // Smoothing constant
            double ema = 0;

            // Start with an SMA for the first period's EMA calculation
            if (values.Count >= period)
            {
                ema = values.Take(period).Average();

                // Apply the EMA formula for each value beyond the initial period
                for (int i = period; i < values.Count; i++)
                {
                    ema = (values[i] * k) + (ema * (1 - k));
                }
            }

            return ema;
        }

        private double CalculateSMMA(List<double> values, int period)
        {
            if (values.Count < period) return 0; // Not enough data

            // Initialize SMMA with the first period's SMA
            double smma = values.Take(period).Average();
            double multiplier = 1.0 / period;

            // Start calculating SMMA from the next point after the initial SMA
            for (int i = period; i < values.Count; i++)
            {
                smma = (smma * (period - 1) + values[i]) * multiplier;
            }

            return smma;
        }

        private double CalculateLWMA(List<double> values, int period)
        {
            if (values.Count < period) return 0; // Not enough data

            double sum = 0;
            double weightSum = 0;

            // Start from the point where the full period is available
            for (int i = values.Count - period; i < values.Count; i++)
            {
                int weight = (i - (values.Count - period) + 1); // Weight increases from 1 to 'period'
                sum += values[i] * weight;
                weightSum += weight;
            }

            return sum / weightSum;
        }


        public enum MaMode
        {
            SMA,
            EMA,
            SMMA,
            LWMA
        }
    }
}
References:
- Granville, J. E. (1963). Granville's New Key to Stock Market Profits. Prentice-Hall. This book by Joseph Granville introduces the On-Balance-Volume (OBV) indicator, providing foundational knowledge on its use and significance in market analysis.
- Murphy, J. J. (1999). Technical Analysis of the Financial Markets: A Comprehensive Guide to Trading Methods and Applications. New York Institute of Finance. Murphy's book is a staple in the field of technical analysis, offering insights into various indicators, including the OBV. It's an excellent resource for understanding technical analysis's theoretical and practical aspects.
- Achelis, S. B. (2000). Technical Analysis from A to Z, 2nd Edition. McGraw-Hill. Achelis provides an encyclopedia of technical indicators, including the OBV. The book is useful for traders and analysts looking to deepen their understanding of technical indicators and their applications.
- Colby, R. W. (2003). The Encyclopedia of Technical Market Indicators, Second Edition. McGraw-Hill. This comprehensive guide includes detailed explanations of various technical indicators, including the OBV, and discusses their practical applications in trading.
- Trading Platforms and Software Documentation: Many trading platforms and software include built-in technical analysis tools, such as the OBV indicator and moving averages. Referencing the specific platform or software documentation can provide insights into how these tools are implemented and used in real-world trading scenarios.
- Featured image by copilot.microsoft.com
No Copyright
- The person who associated a work with this deed has dedicated the work to the public domain by waiving all of his or her rights to the work worldwide under copyright law, including all related and neighboring rights, to the extent allowed by law.
- You can copy, modify, distribute and perform the work, even for commercial purposes, all without asking permission. See Other Information below.
Other Information
- In no way are the patent or trademark rights of any person affected by CC0, nor are the rights that other persons may have in the work or in how the work is used, such as publicity or privacy rights.
- Unless expressly stated otherwise, the person who associated a work with this deed makes no warranties about the work, and disclaims liability for all uses of the work, to the fullest extent permitted by applicable law.
- When using or citing the work, you should not imply endorsement by the Valent.com
Disclaimer
The "On_balance_Volume_with_averages" indicator and the concepts discussed herein are provided for informational and educational purposes only. The content is not intended to serve as financial, investment, trading, or any other type of advice. Trading in financial markets involves significant risk, including the potential loss of all invested capital. It is important to conduct your own research and consider seeking advice from independent financial advisors before making any investment decisions.
Please be aware that while the On-Balance-Volume (OBV) indicator and its enhancements with moving averages can provide insights into market dynamics, they do not guarantee profitable trading outcomes. The financial markets are influenced by a multitude of factors, and the performance of any trading strategy or indicator can vary widely.
It is well-documented that a majority of traders and investors may lose money in the markets, due to the inherent risks and the complexity of financial trading. The use of any trading strategy, including the "On_balance_Volume_with_averages" indicator, should be approached with caution and with full awareness of the risks involved.
Users of the "On_balance_Volume_with_averages" indicator or any trading strategy discussed are solely responsible for their investment and trading decisions. The creators, developers, and distributors of the indicator or the content herein cannot be held liable for any financial losses or damages arising from the use of this information.
Always remember that past performance is not indicative of future results. Market conditions can change, and what worked in the past may not work in the future. Exercise prudent risk management, including setting appropriate stop-loss orders to protect your capital against significant losses.
By using the "On_balance_Volume_with_averages" indicator or applying the concepts discussed, you acknowledge and agree to this disclaimer and assume full responsibility for your trading and investment decisions.
Please consult with a qualified financial professional before making any investment or financial decisions. The information presented should not be construed as financial advice or recommendations.
Disclaimer: This material is provided for educational and entertainment purposes only. It does not constitute trading or investment advice. Hypothetical performance has inherent limitations.