The 15-Minute ATR Normalized Range & Breakout Indicator
Article inspired by the YouTube video: "The “OPENING RANGE” Scalping Strategy I Will Use For Life"
A Professional Way to Filter Trades and Place Smarter Stops
Most retail traders focus almost entirely on entries. Professionals focus first on volatility and risk—because without those, even the best entry system eventually fails.
This indicator was designed with that professional mindset in mind.
The 15-Minute ATR Normalized Range & Breakout Indicator is a volatility-aware framework that works on any chart timeframe while always referencing the 15-minute market structure. It answers three critical questions before you ever take a trade:
- Is this market moving enough to justify risk?
- Is the current candle structure favorable for long or short trades?
- Where should a statistically sound stop be placed?
What This Indicator Measures
At its core, the indicator compares the range of the most recent completed 15-minute candle to the 15-minute ATR (Average True Range).
It calculates:
ATR % = {15-Minute Candle Range} / {15-Minute ATR} times 100
This converts raw price movement into a volatility-normalized metric. Instead of guessing whether a candle is “big” or “small,” you get an objective answer.
Why This Matters
- A 40-cent candle on SPY might be huge on a low-volatility day
- That same candle might be meaningless during a high-volatility open
By normalizing everything to ATR, you avoid trading:
- Markets that are too dead to move
- Markets that are so volatile that risk becomes unstable
The Volatility Filter (Why It Works)
This indicator only becomes “active” when the most recent 15-minute candle falls within a user-defined ATR range, for example:
- Minimum: 1.0 × ATR
- Maximum: 3.0 × ATR
This creates a professional volatility filter:
| Market Condition | Result |
|---|---|
| Sub-ATR candles | No trade interest |
| 1–3× ATR candles | Optimal trade environment |
| Extreme expansion | Risk increases – filtered out |
This is the same logic used in:
- Opening Range Breakout systems
- Institutional volatility filters
- Quant regime detection models
Directional Logic (Bull vs. Bear)
The indicator reads the 15-minute candle structure:
- Bullish candle: Close > Open → Long-biased environment
- Bearish candle: Close < Open → Short-biased environment
This prevents you from:
- Forcing long trades in bearish expansion
- Forcing shorts in bullish momentum
ATR-Based Stop Placement (The Dots)
When a valid 15-minute candle appears, the indicator automatically plots two volatility-adjusted stop levels:
For Long Setups (Bullish 15m Candle)
- 0.5 × ATR below the 15-minute low (tight stop)
- 1.0 × ATR below the 15-minute low (normal stop)
For Short Setups (Bearish 15m Candle)
- 0.5 × ATR above the 15-minute high
- 1.0 × ATR above the 15-minute high
These dots are:
- ✅ Only plotted when ATR conditions are valid
- ✅ Fully adaptive to volatility
- ✅ Designed for risk management—not entries
This replaces:
- Fixed tick stops
- Arbitrary percent stops
- Emotion-driven stop placement
With statistically consistent risk positioning.
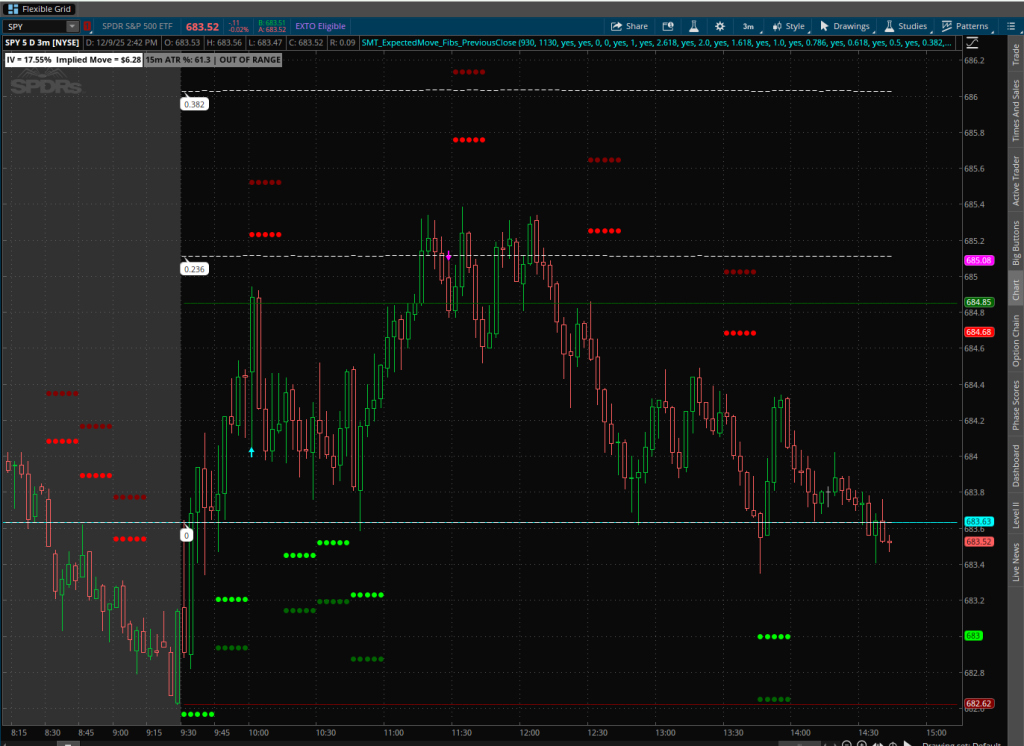
Breakout Entry Markers (What They Mean)
The indicator also includes optional 15-minute breakout arrows:
- Long breakout: Price breaks above the 15-minute high
- Short breakout: Price breaks below the 15-minute low
These arrows only appear when:
- The ATR range requirement is met
- The breakout matches the 15-minute candle direction
⚠️ Important:
These arrows are candidate trade locations, not “auto-buy” signals. They highlight where volatility expansion and structure agree—not whether your personal system approves the trade.
How to Use This Indicator Properly
This tool is best used as a volatility and risk engine, layered on top of another strategy:
Step 1 — Wait for ATR Validation
Only pay attention when:
- The label turns GREEN (bullish) or RED (bearish)
- The ATR % is inside your valid range
Step 2 — Use Your Own Entry System for Confirmation
Examples of confirmation tools:
- Moving average slope (ZLEMA, Hull, VWAP)
- Market structure breaks
- Volume expansion
- Trend alignment across timeframes
- Momentum oscillators
The indicator tells you:
“The market is statistically ready for a trade.”
Your strategy decides:
“This is the exact spot to enter.”
Step 3 — Use the ATR Dots for Risk
Once you enter:
- Conservative traders use the 0.5× ATR stop
- Standard risk traders use the 1.0× ATR stop
- Advanced traders scale partials using both
What This Indicator Is NOT
This tool is not:
- A full strategy
- A guaranteed signal generator
- A replacement for discipline or analysis
It is a professional-grade framework for:
- Volatility validation
- Directional bias alignment
- Stop placement standardization
Why This Approach Is Statistically Sound
Most failed systems break due to:
- Inconsistent volatility conditions
- Random stop placement
- Trading during compressed or chaotic regimes
This indicator directly solves all three problems by:
- Normalizing movement to ATR
- Enforcing structural confirmation
- Locking stops to volatility instead of emotion
That’s why this approach scales cleanly across:
- Index futures
- ETFs
- Large-cap equities
- Intraday and swing trading
Final Thoughts
The 15-Minute ATR Normalized Range & Breakout Indicator doesn’t try to tell you what to trade. It tells you when the market conditions are worth trading—and how to manage risk when you do.
When paired with a solid confirmation system, it becomes a powerful component of a professional-grade trading workflow.
You can download the indicator directly from ThinkOrSwim here: http://tos.mx/!fDbX3MEo
# ==========================================================
# 15-Minute ATR Normalized Candle + Dynamic Stop Engine
# + 15m High/Low Breakout Entry Markers
# Works on ANY chart timeframe using 15m reference candles
# Attribute: stockpsyop@gmail.com with TheValent.com
# Use at your own risk.
==========================================================

declare upper;

# ---------------------------
# USER INPUTS
# ---------------------------
input atrLength    = 14;      # ATR length (default 14, user adjustable)
input minATRmult   = 1.0;     # Minimum valid candle size (1x ATR)
input maxATRmult   = 3.0;     # Maximum valid candle size (3x ATR)

input showStopDots    = yes;
input showEntryArrows = yes;

# ---------------------------
# 15-MINUTE DATA (MTF SAFE)
# ---------------------------
def o15 = open(period  = AggregationPeriod.FIFTEEN_MIN);
def h15 = high(period  = AggregationPeriod.FIFTEEN_MIN);
def l15 = low(period   = AggregationPeriod.FIFTEEN_MIN);
def c15 = close(period = AggregationPeriod.FIFTEEN_MIN);

# ---------------------------
# 15-MINUTE ATR
# ---------------------------
def tr15  = TrueRange(h15, c15, l15);
def atr15 = Average(tr15, atrLength);

# ---------------------------
# 15-MINUTE CANDLE METRICS
# ---------------------------
def candleRange15 = h15 - l15;
def atrMultiple   = candleRange15 / atr15;
def atrPercent    = atrMultiple * 100;

# ---------------------------
# VALIDITY FILTER
# ---------------------------
def validATR = atrMultiple >= minATRmult and atrMultiple <= maxATRmult;

# ---------------------------
# DIRECTION LOGIC (15m)
# ---------------------------
def isBull = c15 > o15;
def isBear = c15 < o15;

# ---------------------------
# ATR STOP LEVELS (REFERENCE)
# ---------------------------
def stopLong_05  = l15 - (0.5 * atr15);
def stopLong_10  = l15 - (1.0 * atr15);

def stopShort_05 = h15 + (0.5 * atr15);
def stopShort_10 = h15 + (1.0 * atr15);

# ---------------------------
# CONDITIONAL STOP DOTS
# (ONLY when ATR criteria is met)
# ---------------------------
plot LongStopDot_05  = if showStopDots and validATR and isBull then stopLong_05 else Double.NaN;
plot LongStopDot_10  = if showStopDots and validATR and isBull then stopLong_10 else Double.NaN;

plot ShortStopDot_05 = if showStopDots and validATR and isBear then stopShort_05 else Double.NaN;
plot ShortStopDot_10 = if showStopDots and validATR and isBear then stopShort_10 else Double.NaN;

LongStopDot_05.SetPaintingStrategy(PaintingStrategy.POINTS);
LongStopDot_10.SetPaintingStrategy(PaintingStrategy.POINTS);
ShortStopDot_05.SetPaintingStrategy(PaintingStrategy.POINTS);
ShortStopDot_10.SetPaintingStrategy(PaintingStrategy.POINTS);

LongStopDot_05.SetDefaultColor(Color.GREEN);
LongStopDot_10.SetDefaultColor(Color.DARK_GREEN);
ShortStopDot_05.SetDefaultColor(Color.RED);
ShortStopDot_10.SetDefaultColor(Color.DARK_RED);

LongStopDot_05.SetLineWeight(4);
LongStopDot_10.SetLineWeight(4);
ShortStopDot_05.SetLineWeight(4);
ShortStopDot_10.SetLineWeight(4);

# ---------------------------
# BREAKOUT ENTRY CONDITIONS
#  - Only when ATR is in range
#  - Only in direction of 15m candle
# ---------------------------

# Long breakout: bullish 15m, ATR valid, break above 15m high
def longBreak =
    validATR and isBull and
    close[1] <= h15 and close > h15;

# Short breakout: bearish 15m, ATR valid, break below 15m low
def shortBreak =
    validATR and isBear and
    close[1] >= l15 and close < l15;

plot LongEntryArrow =
    if showEntryArrows and longBreak then low else Double.NaN;
plot ShortEntryArrow =
    if showEntryArrows and shortBreak then high else Double.NaN;

LongEntryArrow.SetPaintingStrategy(PaintingStrategy.ARROW_UP);
LongEntryArrow.SetDefaultColor(Color.CYAN);
LongEntryArrow.SetLineWeight(3);

ShortEntryArrow.SetPaintingStrategy(PaintingStrategy.ARROW_DOWN);
ShortEntryArrow.SetDefaultColor(Color.MAGENTA);
ShortEntryArrow.SetLineWeight(3);

# ---------------------------
# DYNAMIC LABEL
# ---------------------------
AddLabel(
    yes,
    "15m ATR %: " + Round(atrPercent, 1) +
    (if isBull and validATR then
        " | LONG STOPS: " + Round(stopLong_05, 2) + " / " + Round(stopLong_10, 2)
     else if isBear and validATR then
        " | SHORT STOPS: " + Round(stopShort_05, 2) + " / " + Round(stopShort_10, 2)
     else
        " | OUT OF RANGE") +
    (if longBreak then " | ENTRY: LONG BRK"
     else if shortBreak then " | ENTRY: SHORT BRK"
     else ""),
    if isBull and validATR then Color.GREEN
    else if isBear and validATR then Color.RED
    else Color.GRAY
);
📌 Disclaimer
The information provided in this article and the accompanying indicator is for educational and informational purposes only and should not be construed as financial, investment, or trading advice. Trading stocks, options, futures, and other financial instruments involves substantial risk of loss and is not suitable for all investors.
Past performance, whether from backtesting, simulations, or live examples, does not guarantee future results. Market conditions change, and no strategy or indicator can guarantee profits or prevent losses. All examples shown are for illustration purposes only and do not represent actual or guaranteed performance.
This indicator is designed as a volatility filter and risk-management framework, not as a standalone trading system. It is strongly recommended that users apply independent confirmation methods, proper position sizing, and disciplined risk control when using this tool.
You are solely responsible for all trading decisions and outcomes. Always consult with a licensed financial professional before making any investment or trading decisions.
Disclaimer: This material is provided for educational and entertainment purposes only. It does not constitute trading or investment advice.